Saturday, August 20, 2011

Dive time histogram

I did my longest dive ever a few days ago, clocking in at 169 minutes...I was trying to collect enough snails to run this experiment. Similar to what I did when I logged my coldest dive ever, I am histogramming my dive log by dive time to see just how extreme this value is. The answer is: very.


I also looked at dive time by dive type. Here is a graph of scientific vs. recreational dive times. I have 170 scientific dives and 54 recreational dives logged, so I plotted frequency rather than absolute counts to get a better comparison of the distributions. They are quite different! It seems that my longest and shortest dives have been research dives, and the scientific dive distribution is much more spread out than the recreational dive distribution. Interestingly enough, they have similar medians that fall in the 40-50 min bin.


Friday, June 17, 2011

Aestivation

This blog has been pretty quiet for a while, and is looking to remain that way over most of the summer. I first started this as a way to quantitatively visualise and analyse mundane things during the school semester. Now that the summer field season is well under way, I spend less time thinking about mundane things and more time thinking about my research. So there will be less graphing going on in the next few months, but this blog will definitely be back when school starts up again in the fall.

In the meantime, you can check out what I'm up to in the great and awesome world of field marine ecology at http://smallsotongbigocean.blogspot.com/

Saturday, May 28, 2011

Off meal plan (junior year roundup)

Out of 3 months' worth of posts on this blog, the most viewed post (I love the blogger stats feature!!) has been this one on the difference between Brown's meal plan and my being off meal plan. I fond that really interesting, because I thought that some of the other graphs were more interesting (at least, I had more fun making them). But I guess $$$ issues are always going to be taken seriously.

About a week ago meal plan ended - i.e. dining halls closed and everyone was left to fend for themselves. So now I had exact numbers to compare for meal plans vs. feeding myself for an equivalent amount of time. And then I waited around for a week waiting for research plans to be approved, etc - giving me time to graph them. I think this graph is a bit of an improvement over the last because it shows actual values, and puts the numbers in terms of things that are a bit more tangible, especially to students. Also, it has many colours! that I think (and hope) complement the numbers rather than distract.

Some of these things are probably more relevant to me (I bought my ticket to Quito, Ecuador a few weeks ago, and the rent/average grocery expenditure numbers are mine) but I think

Also, this doesn't even touch on what happens when you compare costs of living and focus just on basic needs...I pay $38 a month to feed and educate a little boy in Indonesia, and the $2174 would support him for 57.2 months = almost 5 years. He would be 12 years old before that money ran out.

Wednesday, May 25, 2011

The world according to Wikipedia

This is not-a-graph that is the direct result of this xkcd comic*, which has the following gem in the mouseover:
Wikipedia trivia - if you take any article, click on the first link in the article text not in parenthesis or italics and then repeat, you will eventually end up at "Philosophy."
It is true probably because the first paragraph of every article attempts to put the topic in a wider context, which means the first link will probably lead to a topic broader than the previous one, and all roads lead back to how we organise information and knowledge, and how we think -- philosophy!!

But what is just as interesting is how all those paths converge. So I did some clicking around, and came up with this diagram. It traces fields of study (=majors, ="concentrations" because Brown needs to be special) offered at the undergraduate level at Brown University (see a list here) through the Wikipedia maze and shows how they all converge onto philosophy. This is an incomplete selection of concentrations because not all would fit, and I excluded 'sub-field' concentrations e.g. biochem, biophysics, geo-bio...with the exception of marine biology, which is my concentration and therefore I am obviously biased toward wanting it in there.

Interestingly enough, there are only 3 links into philosophy for 40+ fields of study mapped, and the third link only includes one field, education. Everything else eventually goes back to math or to academia, academic communities and interactions. Some paths are also surprisingly weird...check out engineering and business studies. Business studies is linked through 'planet' but astronomy isn't.


*it is also the result of Jenni posting this on Facebook so that I was thoroughly distracted for the rest of the night and did no studying for my GRE. so this entire post is her fault.

Monday, May 23, 2011

Graphing finals

I have been busy studying for the past two weeks or so, but finals are over, grades are in and I am all moved out of my dorm and essentially waiting for the summer to really begin. I am supposed to be up in Nahant, MA running transects for algal biomass but I don't have an approved dive buddy to work with yet so I am stuck here in Providence for now.

So I decided to make some graphs and look at the thing that sapped the last couple of weeks of my life...finals! Armed with Brown's final exam schedule and course enrollment numbers from Banner, my plan was to look at how the number of exams taken (=number of people taking exams) changes over time, by department. Unfortunately, that was far too hard to make any sense of - data overload and lines everywhere. So I changed my analysis a little.

First of all: Here is a simple graph of the total number of exams taken by department. As you can see, the econ department gives out the most exams by far, with the biology department coming in a distant second.


This kind of follows my original idea of tracking number of exams over time in a more manageable way. Brown follows an exam schedule that has two final exam sessions a day (9am and 2pm) and so exam session 1 on the graph corresponds to 9am on May 11 and session 18 to the very last session, 2pm on May 20. The black line is the trend for all departments combined, which is pretty close to a straight line. I also plotted the data for selected departments/areas in comparison. It looks like it is a good thing to be taking math and humanities classes because an average you get done early, whereas it's not so great to be doing econ or political science, and it sucks to be taking physics (I know; I took physics and its very-last-day final).
I admit that lumping all the humanities together is completely arbitrary and reflects my science bias...oh well, I don't think humanities people take that many exams anyway. And the final exam schedule does not give any information about final papers, etc.

Sunday, May 8, 2011

The General Election, in Facebook-land

Thanks to the General Election I was supremely unproductive yesterday. I am actually not 100% sure what I feel about the results themselves. But there is change in the air that makes it hard not to be excited. And I am optimistic enough to believe that the change will be for the better.

Anyway, there has been a lot said about the role of social media in this election. I was certainly thinking that as I watched the updates roll in on Twitter while Channel News Asia did their millionth 'analysis' of the constituencies and candidates and then started talking about Osama and golf results (!?!). But sometimes the role of social media can be a little...overblown?

I did a brief survey of a bunch of Facebook fan pages this morning, and here is what I found.

(data correct at time of collection, ~10am EDT; almost certainly no longer correct)

So apparently the returning officer who has burned "pursuant to Section 49, Subsection 7E, Paragraph A of the Parliamentary Elections Act" into our brains forever is better liked than the PM. The ranting can start now.

I will add that if you use Facebook likes as an actual measure of things liked, I am like that grumpy old man who hates the world and waves his cane at small children. For the record, I actually like small children, except on planes.

Saturday, April 30, 2011

People you may know

The 'people you may know' feature on Facebook is fascinating and creepy. I guess you could say the same for many things that Facebook does, like telling you where and when you met someone based on a series of assumptions. Anyway, the point is that the little friend-suggestion sidebar is always staring at me, and I have looked at the expanded page a couple of times before, but I decided to take a more detailed look at what it was up to.

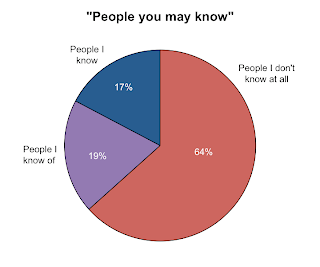
I scrolled down the page and took notes on (1) which row of friend suggestions each person showed up in, where the top row = 1; (2) the number of mutual friends reported; and (3) whether I actually knew the person. Here, I categorised "people I know" as someone I would recognise and talk to if I ran into them on the street, and who would most likely do the same. "People I know of" are generally people I know of through other people and may have met once. I might recognise them on the street but talking to them would probably be awkward or creepy. I scrolled and recorded until I got bored of scrolling and writing, which is of course an extremely systematic way to collect data. But that came up to a decent sample of 242. It turns out I don't know most people on that page.

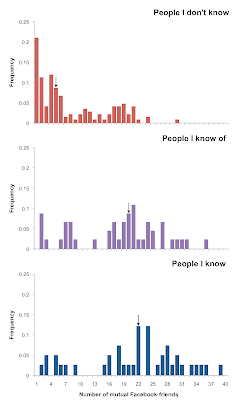
When it suggests people it thinks you might want to 'friend', Facebook tells you how many Facebook-friends you have in common. So I took a look at how good an indicator this actually is for predicting if you actually know someone. Here are the distributions for the number of Facebook-friends I had in common with people that were suggested, sorted by whether I knew them. The arrows indicate median values. The median number of mutual Facebook-friends did increase across the categories, though they are similar for people I know and people I know of.

But the real question is, how well does Facebook's metric of 'number of mutual Facebook-friends' predict whether I might actually want to be Facebook-friends with friend suggestion X? That's the basic purpose behind this annoying little sidebar on Facebook, right? So I collapsed the first two categories (people I don't know and people I know of...but not enough to be a 'friend' and not a creeper) into one where "Consider Facebook-friending = 0" and the third category of people I know was "Consider Facebook-friending = 1*"

Here is a logistic regression I ran in Stata with the number of mutual friends as a single predictor. It actually turns out a statistically significant relationship (P<0.001) that is not a particularly good fit to the data. But on average, I get a 13% increase in the odds that I will actually be interested in friending someone with every one more mutual Facebook-friend.

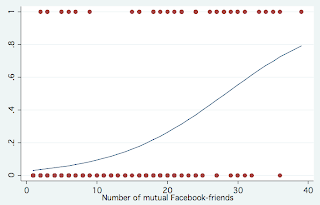
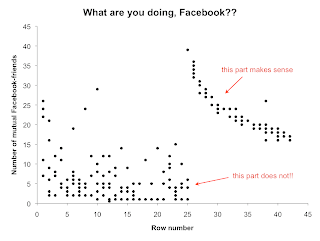
I guess that is basically saying what everyone kind of knows already: that if you have more friends in common with someone, you are more likely to know them, even in Facebook-world. So if Facebook was aiming to suggest people that you are likely to click on/friend on its "people you may know" page, it would start the list with people who had more mutual Facebook-friends and go down from there, right? I guess not. This is what I got plotting the number of mutual friends for each person against how far down the page they were (row number). It is rather strange. There is a nice negative relationship starting at the 26th row (a point which any person who wasn't looking for useless data would be unlikely to get to) and a big mess in all the top rows. I have no idea what is going on here...


* I did not actually friend any of them. There are already too many people on my facebook.

Thursday, April 28, 2011

Student activity monitor!

The blog has been quiet for a while, but I've been putting that time to good use by collecting data. Some time ago I realised that this little panel on the MyCourses* page had been staring at me all along. It tells you how many people from each of your classes are logged on to the system (and you can see who they are). So I basically have a way to track student activity over time. Over the past 2+ weeks I have been recording the time and the number of online students by course every time I logged on, with at least 20-minute intervals between consecutively recorded data points.


The UCS, UFB and CCB Elections category is a dummy course that contains candidate statements, endorsements, etc. for the elections and presumably, all undergraduates are 'enrolled' in this dummy course on the system. This gives me a large enough sample to look at general patterns of student activity over a general 24 hour period on a weekday. It is actually quite interesting! It looks like peak hours of academic activity are in the mid-afternoon 2-3ish and at night. In the morning there is a steep increase from 9 to noon and there is a noticeable drop around dinnertime.

Of course, this is as much of a graph of my own activity as of general student activity (since I can only get the numbers when I log on to the system myself). I am almost never up past midnight and I generally get up between 7 and 7.30am so there is a big data hole between midnight and 7. I would love to fill in some of it, particularly the 12mn to 2? 3? 4? am part because I want to know what time the number starts falling and people go to bed. But my sleep > data on other people's sleep so I may never know. (If you are a late night-early morning worker and want to help me collect data on this you are most welcome to!)

Breaking it down by class, these are trends for physics 40 (which I take) and bio 42 - ecology (which I TA). These are standardised by the total class size (physics has slightly more than 3 times as many enrolled students as ecology). They both show similar trends of steep increase in the morning, but are much more variable for the rest of the day (though if you take the average it would be pretty much a straight line from noon to midnight). My favourite part about these graphs are the outliers :)

I think this is something worth looking at again next semester, over a longer period of time. It might also be fun to compare weekends vs. weekdays and...so many things.


*people from Singapore: MyCourses is pretty much exactly like the NUS IVLE, but with a clunkier interface.

Sunday, April 17, 2011

Algae people!

I attended my second scientific conference in five weeks (also my second conference EVER) this weekend: the 50th anniversary symposium of the Northeast Algal Society at Woods Hole. As might be expected from a group that focuses on algae, this was a much smaller, intimate conference than the Benthic Ecology Meeting, and they gave everyone a full list of attendees' names, affiliations and contact information. AKA graphable data. So here we go...

I wanted to look at where people were from, i.e. which institutions sent the most algae people out to Woods Hole. This graph is something similar to a rank abundance curve, with institutions ranked by the number of attendees on the abscissa and the number of attendees on the ordinate (the terms 'abscissa' and 'ordinate' make me happy because though they are so ridiculously obscure). The institutions with the biggest contingents were: University of New Brunswick, UConn, URI, UNH and Northeastern. I was the only one from Brown :)


Here is a plot of how far people were from their home institution. It is based on point to point distance measurements in Google Earth, so it most certainly underestimates the actual distance traveled by each person (especially because Cape Cod is a funny shape).


Woods Hole is awesome and today was sunny so I was very happy. Here is a picture from near the conference building.

Wednesday, April 13, 2011

Minimum ages

I spent most of today making regression models to analyse nutritional data from the McDonalds menu for my statistics class. It was surprisingly fun.

Unrelatedly, here is a quick graph.


Make of it what you will.

I'm not voting in this year's election because I no longer have an address in Singapore and therefore I no longer have a constituency :(

Sunday, April 10, 2011

My mileage*

I should be studying physics, but I found a great distraction: graphing the total (cumulative) distance I've travelled since the start of freshman year. This includes travel by air, road, rail and water that is from one town/city to another (so it excludes general day to day moving around, going to the grocery store etc. but includes things like Providence to Newport or Nahant).

I was quite impressed. I've done slightly over 120,000 miles, which is almost 5 times around the Earth, and about halfway to the moon. I haven't quite made the entire Canadian coastline, though...
I'm going to keep this dataset and re-graph it when I graduate. How many miles can one travel in 4 years of undergrad education? We shall see.


* Obviously I am using miles because I have lived in the US too long.

Friday, April 1, 2011

"Spring Break"


My next real break will probably occur in 2012. At least spring will get here sooner...

Thursday, March 31, 2011

Temperature histogram

In commemoration of the coldest dive I have ever done in a wetsuit, this is a histogram of the water temperatures I have encountered throughout my 160+ dives. Red is for warm water dives (i.e. in a 3mm wetsuit or shorty) and blue is for cold water dives (7mm suit and hood).

At 5ºC, yesterday's dive was a full 3ºC below my previous low (~8ºC at Friday Harbor).

Tuesday, March 29, 2011

Graphs of a blog of graphs

It's about time this happened, because there was no way I could let these pretty graphs just sit there. Blogger records visitor stats for the blogs it hosts and graphs them. So there are graphs of this blog's visitor traffic. Fig. 1 is a graph of visitor operating systems.

Fig. 1. Visitor operating systems for this blog

Compare that with the OS composition of another more high-traffic Blogger-hosted blog with stats I can access: the TA-run Brown ecology class blog (Fig. 2). Brown is rather maccy in general, but this is a really big difference!!

Fig. 2. Visitor operating systems for Brown ecology class blog

Finally, a general comparison is in order. As I did before when comparing my class diversity over time, this is basically a H' index. I wonder what Shannon et al. would think of my using their index to quantify diversity in ridiculous things, but it's the most familiar measure of diversity to me and here it is (Fig. 3).
Fig. 3. Diversity of this blog vs. the ecology blog

Of course, my real point in posting all these graphs is this idea: if I blog the graphs of the blog and then graph the blog of the graphs of the blog etc. etc. IT WOULD GO ON FOREVER!!!

Next time: web browser diversity!


As a side note: There is obviously some non-independence going on here (e.g. repeat visitors, of which I am sure there are many many many). But this is Blogger's fault and not mine and I am not making any statistical inferences here, so I'm going to pretend all is fine.

Monday, March 28, 2011

Operation retrieve dive gear

Success. Did not get lost or stuck waiting for the next 2.5-hourly bus!

Not the most efficient, but I am still really thankful for public transport. And now my gear is ready to help me freeze while running transects in Nahant this week.

Also: I never knew Providence had a 'Nahant Street' but apparently it does. It is a tiny little street off Charles Street. I passed it on the bus today.

Saturday, March 26, 2011

Why "earth hour" annoys me

Because I see no reason to sit in the dark for an hour (other than making yourself feel all fuzzy inside) when there are a million other things you could do to cut energy use more effectively (and without cutting productivity). Like turning off the lights when you're not using them, and not running the hot water when you're not even touching the water, and not taking hour-long hot showers (I am especially bothered by people wasting water because it's like a 2 in 1 'water and energy' going down the drain).


* My room is lit by 2 x 36W fluorescent bulbs in a standing lamp.
** Taking an average shower flow rate of 2.5 gal/min, numbers from here. Note that this is calculated assuming 100% efficiency of the water heater, which is an impossibility, so any realistic value would be higher than what is graphed.

Off meal plan

This is a graph idea that came out of the inevitably frequent conversations with people on my hall and other 'off meal plan' upperclassmen about how ridiculously expensive the college meal plan is. I think it comes out to something like $9 a meal, but a number like that is not that easy to compare to the less well-defined manage-your-own-food-budget. I generally think of meal plan as 'a lot' more expensive than off meal plan but have no clear conception of what 'a lot' is. I decided it would be easier to visualise if I graphed it.

I was pretty surprised at how much 'a lot' really was. My initial idea was to stack things up on my 'off meal plan' bar until it equaled the meal plan bar but I pretty much ran out of 'large expense' things to stack, with over $200 to go.

The graph isn't meant to convey an expenditure switch because none of the other expenses actually 'came out' of meal plan money - Benthics $$ came out of a Brown travel grant and TA stipend, NEAS from the stipend and a research assistant job, dive gear came out of a summer research fellowship, etc. - it's just a visual comparison of magnitude.

Other (qualitative) benefits of not paying the college to make food for you:
1. flexibility
2. feeling like a real person
3. not being utterly lost and helpless when the dining halls close (spring break week, ha.)

Okay I am off to make lunch and work my butt off so I can spend the second half of next spring break freezing in Nahant water and looking for algae.

Friday, March 25, 2011

In and out

I've been scrambling to catch up with everything ever since I got back from the Benthic Ecology Meeting five days ago so I haven't had the time to mess around with data and graphs. But now it's spring break, and even though I have a to-do list as long as my arm, there's some time to play around with excel.

Like most conferences that aren't tiny, Benthics has concurrent sessions (4 of them) and they were close enough that it was very easy to switch from one session to another between talks. Each session had 5-10 talks, so 4-9 potential switches in total. Here is a graph of how much switching we all did (as a proportion of how many possible switches there were):

FYI, we are almost but not 'significantly different' from each other (p~0.09). Though I bet if I just ran a paired test between me and Jason we'd be different. I think I just want to believe that I am significantly different from smelly Jason :)

And below is another graph of switches (again, proportion of total possible), this time by session. Yes, there was one session in which I switched rooms at every possible time, though I think it was mostly moving back and forth between two of the rooms.


Also, 2 great graph ideas that may never see the light of ordinate and abscissa:

1. I wanted to graph our individual paths and movements between sessions, but we moved around and crossed between rooms so much that the graph is just a crazy mess of lines which fails to convey the point. Even the above graph (switching by section) is a little but crazy and falls on the very limit of what I consider worth graphing.

2. If I could figure out which combination of talks each person at Benthics attended, I could use some kind of ordination technique (I'm not sure exactly which would be most suitable) to characterise each person relative to everyone else based on that. Then people who cluster together would probably have similar interests and should talk to each other => awesome way to network, right? But it's kind of lame to do this when I only have data for 4 people. Maybe if I go to Benthics again next year I will try and do this...

Friday, March 18, 2011

Networking at Benthics

(estimated in approximate number of hours spent)

I think we are all terrible at networking.

Wednesday, March 16, 2011

From the Benthics Meeting...

Out of 22.5 hours, this is the breakdown:

So ridiculously tired. But so worth it. The conference starts for real tomorrow!

Also: Mobile, AL is a pretty little city.

Tuesday, March 15, 2011

Friend accumulation

I've been working like crazy over the weekend to get everything done before the Benthic Ecology Meeting that starts tomorrow, and I think it's been pretty successful because now I'm sitting here with 4 hours to go before my train leaves and I have nothing pressing to do.

So: in addition to my dive log, guess what is an awesome source of data? Facebook. All the friends I have and all the friends I forgot I had. I decided to graph my Facebook friends against when I first met them. Interestingly but unsurprisingly, there are obvious jumps corresponding to starting at new schools in Primary 4, Secondary 1 and JC. I pretty much lost touch with anyone I went to school with before P4. (The curve starts above zero to account for family members who are older than me.)

Obviously this is a limited dataset because plenty of people aren't on Facebook. I also clean out my friendslist once in a while, so the people graphed are the people I care at least somewhat about. Current total: 273.

On the subject of social networks, my research advisor told me to make the best of this conference and do some networking!!! I think my idea of networking is hanging around networked-people that I know...then when other networked-people come to talk to them, they have to talk to me too to be polite.

Benthics in 24 hours!! :)

Friday, March 11, 2011

Modelling change

So I've been been thinking about math and mathematical models quite a bit lately, partly because they've been showing up in many places this semester.

When I was 8, this was my idea of a model...except that back then I don't think the textbooks were in colour. We drew little bar models all the time. Everyone's models were always straighter and neater than mine, and some kids would bring their colour pencils and colour them in for no good reason at all. Drawing models was the way to solve every math problem and it was awesome until your older neighbour/friend/cousin taught you algebra. Then they became the most ridiculous, tedious things in existence because your teacher wouldn't let you stop using them.

Apparently now they're all the rage among homeschooling parents in the US (and possibly in Utah too?). I guess my messy little primary school self didn't appreciate them enough because I hated having to draw so many straight lines.


Now (10+ years later) models look like this, and there are lots of them everywhere :)
I realised I have actually not had a math class in something like 3.5 years, even though I've used it extensively in some of my classes. I might take an applied math class or two before I graduate...

Wednesday, March 9, 2011

A venn diagram

So am I the "evil TA" ?

I actually don't think I've been to any of my TAs' office hours before. But then I don't really go to review sessions and organised study groups either. I'm a study-hermit.

Also, I just got my first TA-paycheck :)

Turnover times

Turnover times in my life.

Fig. 1. Bar graph of turnover times


It takes longer for a manuscript to get (nicely and helpfully) rejected than it takes a dog to make lots and lots of puppies.
Fig. 2. Puppies

Friday, March 4, 2011

Research diving vs. 'fun diving' (Part 3)

So this is pretty interesting...
(again, p-value from a two-sample t-test in STATA)

I wonder how much 'real-world' significance this has and how much of the difference is actually due to different regions/dive conditions, since both unadjusted air consumption rates and depth-adjusted 'surface air consumption' (SAC) rates* appear to be lower in warm water (with some variation). I think this one will have to sit on the shelf for a while...more data to come late Spring and Summer when I start getting in the water again.

* and here is the graph of SAC rates by temperature, data from the overall Fall 2009-Summer 2010 year that was used for the graphs of original unadjusted and adjusted SAC rates.


Thursday, March 3, 2011

A hypothesis

We talked about density dependence in a tree, masting in another tree and the link between environmental and population synchrony in soil mites. Today was a slow day...

Becoming educated

So taking biochemistry makes me think of my life in RJC, and (somewhat) recently people have been posting links to a couple of blog posts on "growing up in the 90's in Singapore" which unsurprisingly included many references to primary school. Which got me thinking, counting and graphing. This one graph pretty much summarises the last 15 years of my life. Really. I am still a little awed by that fact.

Here are a couple of graphs on the diversity (or 'well-roundedness' which is a term I never really understood because it just made me think of kids in the TAF club) of my education over time. The top graph is a simple count of the number of subject areas (language, math, sciences, social sciences, humanities) each year while the bottom is weighted by the evenness of class composition - basically like a Shannon-Wiener diversity index...BUT FOR CLASSES.


So it looks like I was most diverse around Sec 3 and 4...and least diverse during my 3 seas year. This is what graduate programs do, kids. Expect a downward trend when I start grad school in a couple of years.

Wednesday, March 2, 2011

Research diving vs. 'fun diving' (Part 2)

Obviously this is because I work in shallow old New England.

The p-value is from a two-sample t-test run in STATA.

Tuesday, March 1, 2011

Biochemistry flashback

Every time I sit in my biochemistry lecture this semester I have flashbacks of learning some of the same stuff in the lecture theatre and the "Raffles Rooms" at RJC...something like 4 years ago (!!!). So while going over the lecture slides for the first exam I started keeping a count of 'old material' I learnt in JC1 and JC2 (= US grade 11-12) and 'new material', measured in numbers of content-bearing slides. Then, of course, I graphed it.
So...yeah. At least for the first third of the class, there is not that much new stuff. Plenty of re-learning things I forgot, and plenty of re-discovering that molecular-level things are awesome. So, yay for Singapore and the MOE's grand plan to push students into molecular biology and bio-tech-y things? I think that in the 3+ years since I took my A-levels, I've grown to appreciate the value of the strong background in molecular bio and genetics I got out of MOE's syllabus...at the same time, their attempt to push me in that direction obviously didn't work, and I'm glad it didn't :)


(This post is rightfully dedicated to Dr. Adrian Loo, who pretty much taught me everything in the blue part of the pie, answered all my questions on evolutionary biology and ecology, and enjoys getting students stuck in the mud...)

Histograms!!!

Okay, so it must be that none of my previous instructors have been cool enough to exploit the FULL RANGE OF DESCRIPTIVE STATISTICAL TOOLS on MyCourses because I have never seen this little function before. It is seriously awesome.

Behold the BIOL 28 grade histogram!!!

You can toggle the width of the bins (I think the allowed range is from 3 -65 bins). Below is the largest number of bins for which the interval labels are still readable (after this they kind of smoosh together and you just get vertical lines). I won't say how long I spent toggling them back and forth...
So...apart from being awesome by scanning and grading every single exam (of 255) the same day they were taken, the biochemistry instructors win because they have histograms I can play with.

Sunday, February 27, 2011

Squiddy

This is an old drawing that I made back in freshman year (in intro geology class, I believe). I think my squid drawing abilities are far better than my platypus drawing abilities.


The squid-with-big-gaping-hole-in-mantle is something that I notice everywhere, but when I re-discovered my old cartoon I decided to see how prevalent it actually is. So I ran a quick search for "squid" on Google Images, filtered by "clipart" to see. I excluded photographs and things that were clearly unrelated (e.g. things with the word 'squid' but no actual squid, squid-style multiplugs, people dressed as squids, etc) and put things that were labeled 'squid' but clearly not (e.g. octopuses, jellyfish, cthulhu) under the "Not a squid" category. This survey covers ~20 pages of Google Image results.